While doing my MA, I was introduced to data visualizations. To better learn and understand this area, I decided to use the same data over and over again to see how many different variations I could come up with.
Data is hard! What's important? What is less important? I have since created data visualizations for nonprofits, galleries and museums, and ad agencies.
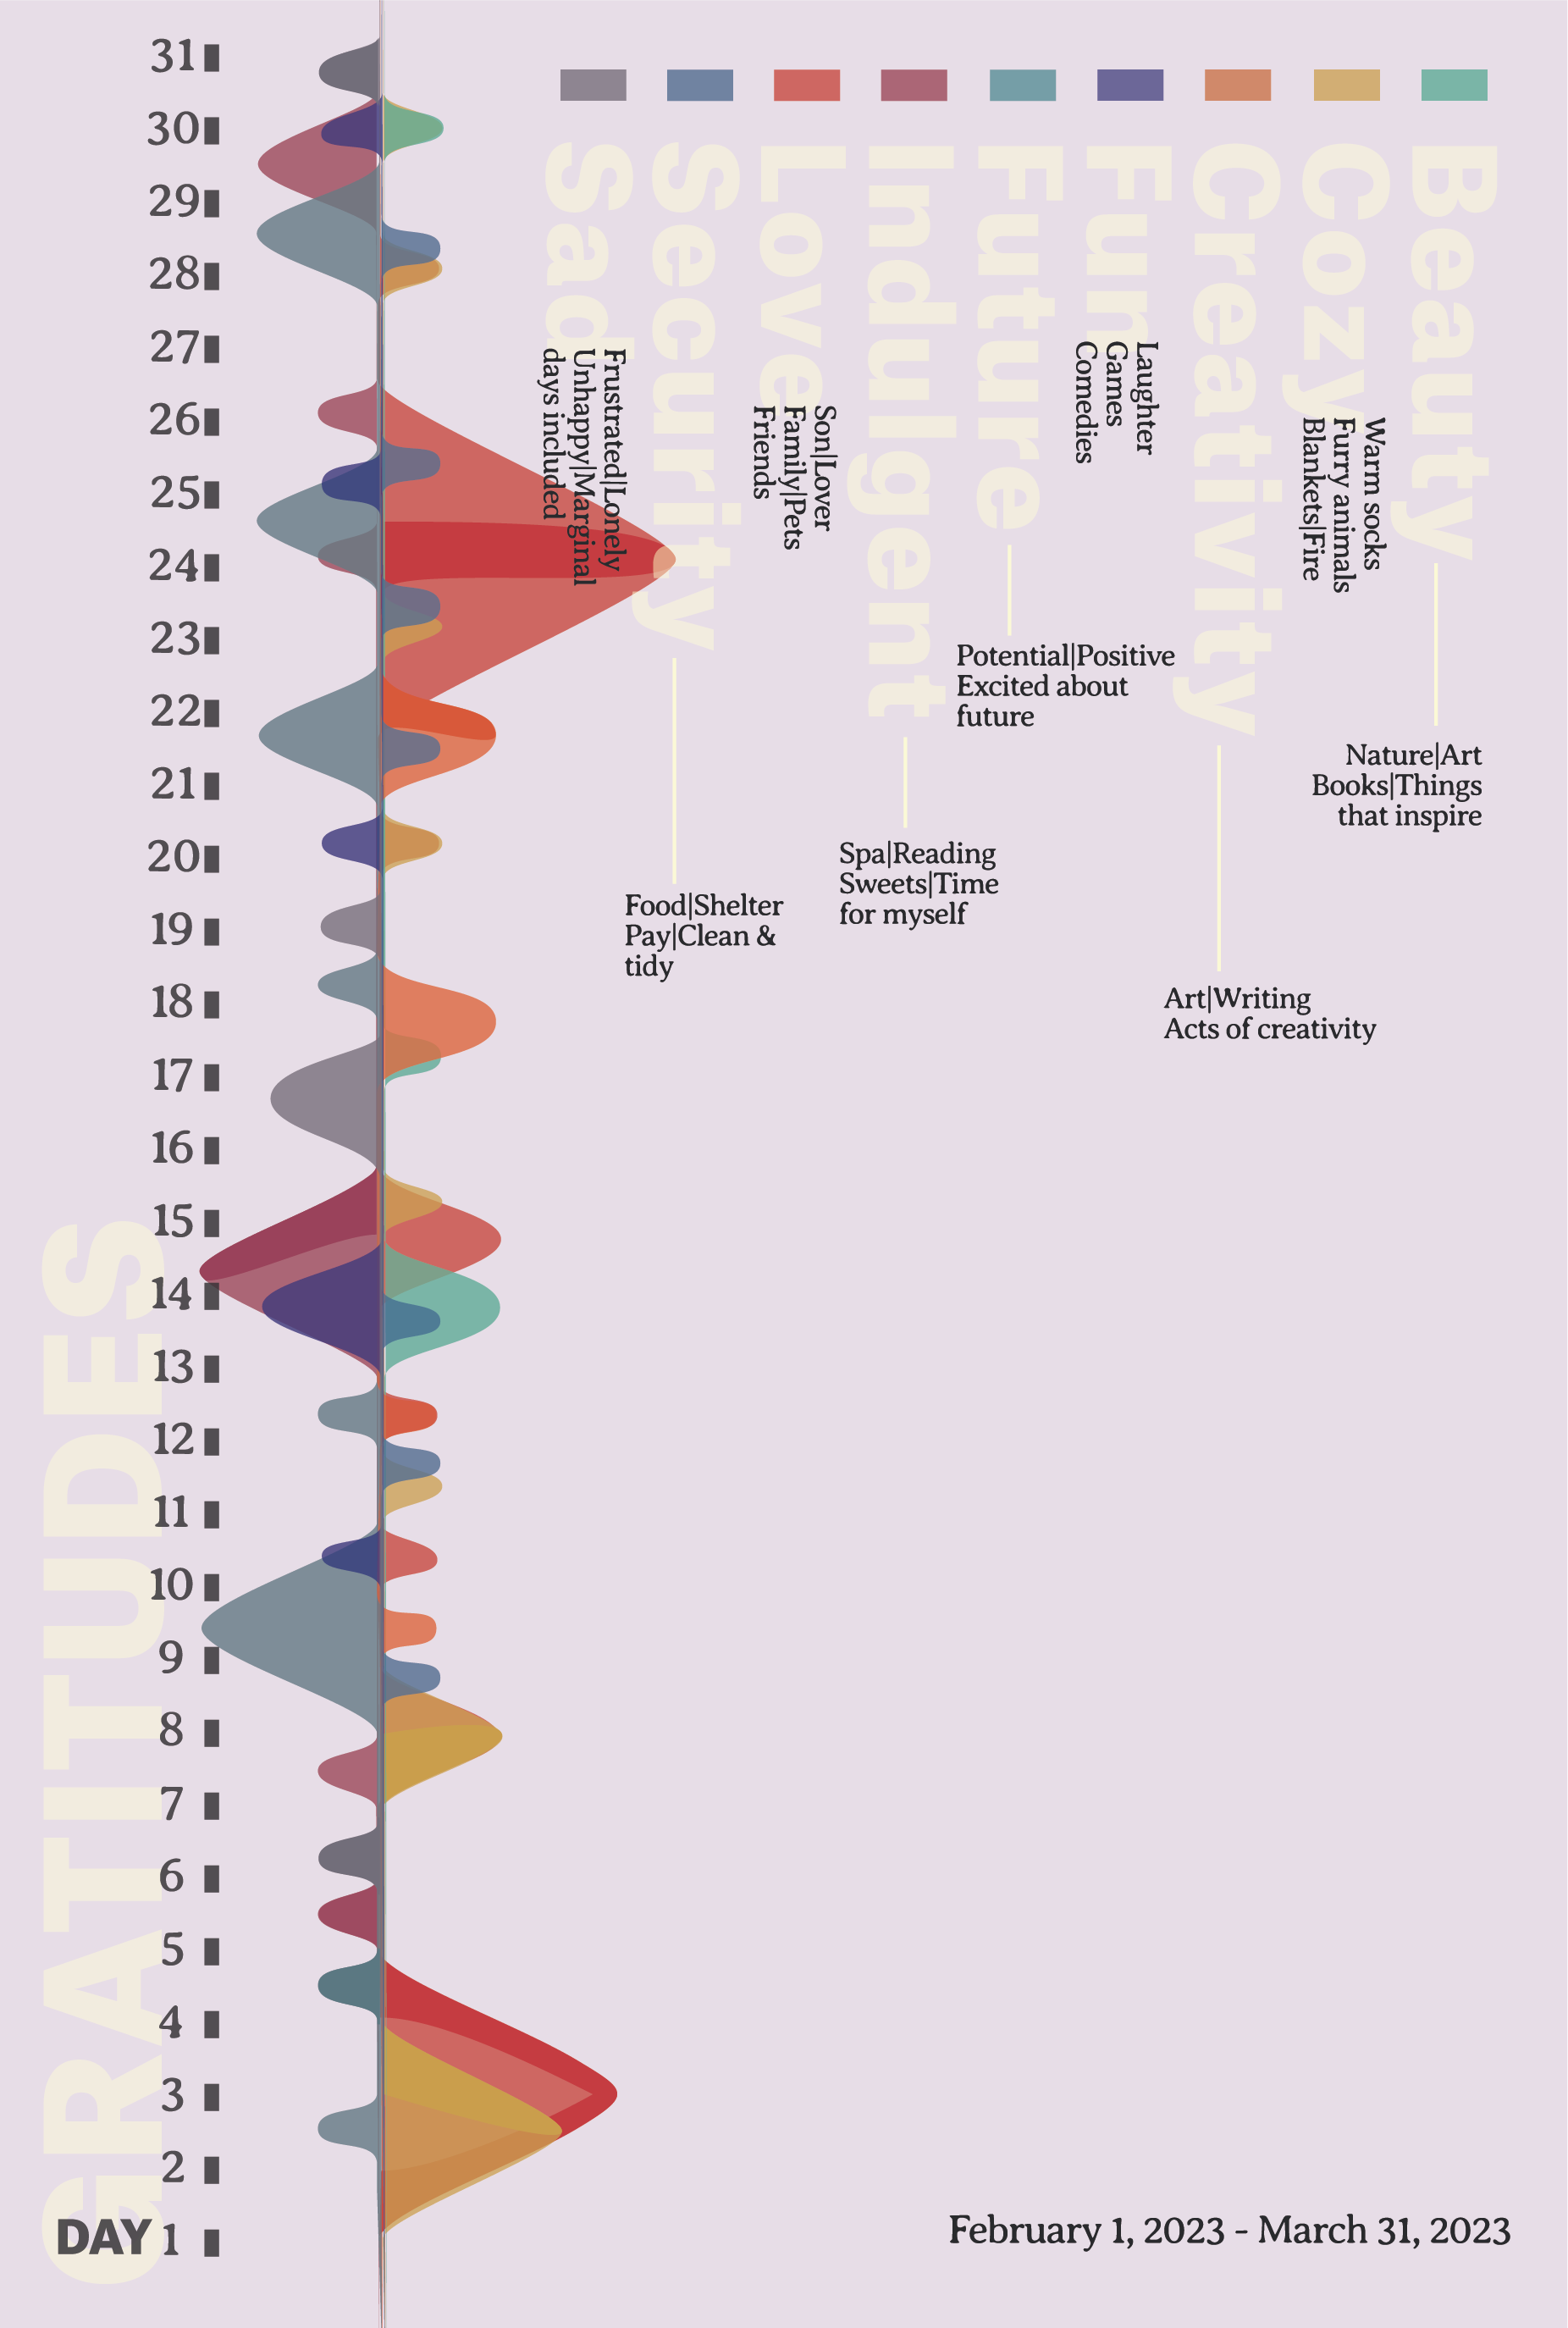
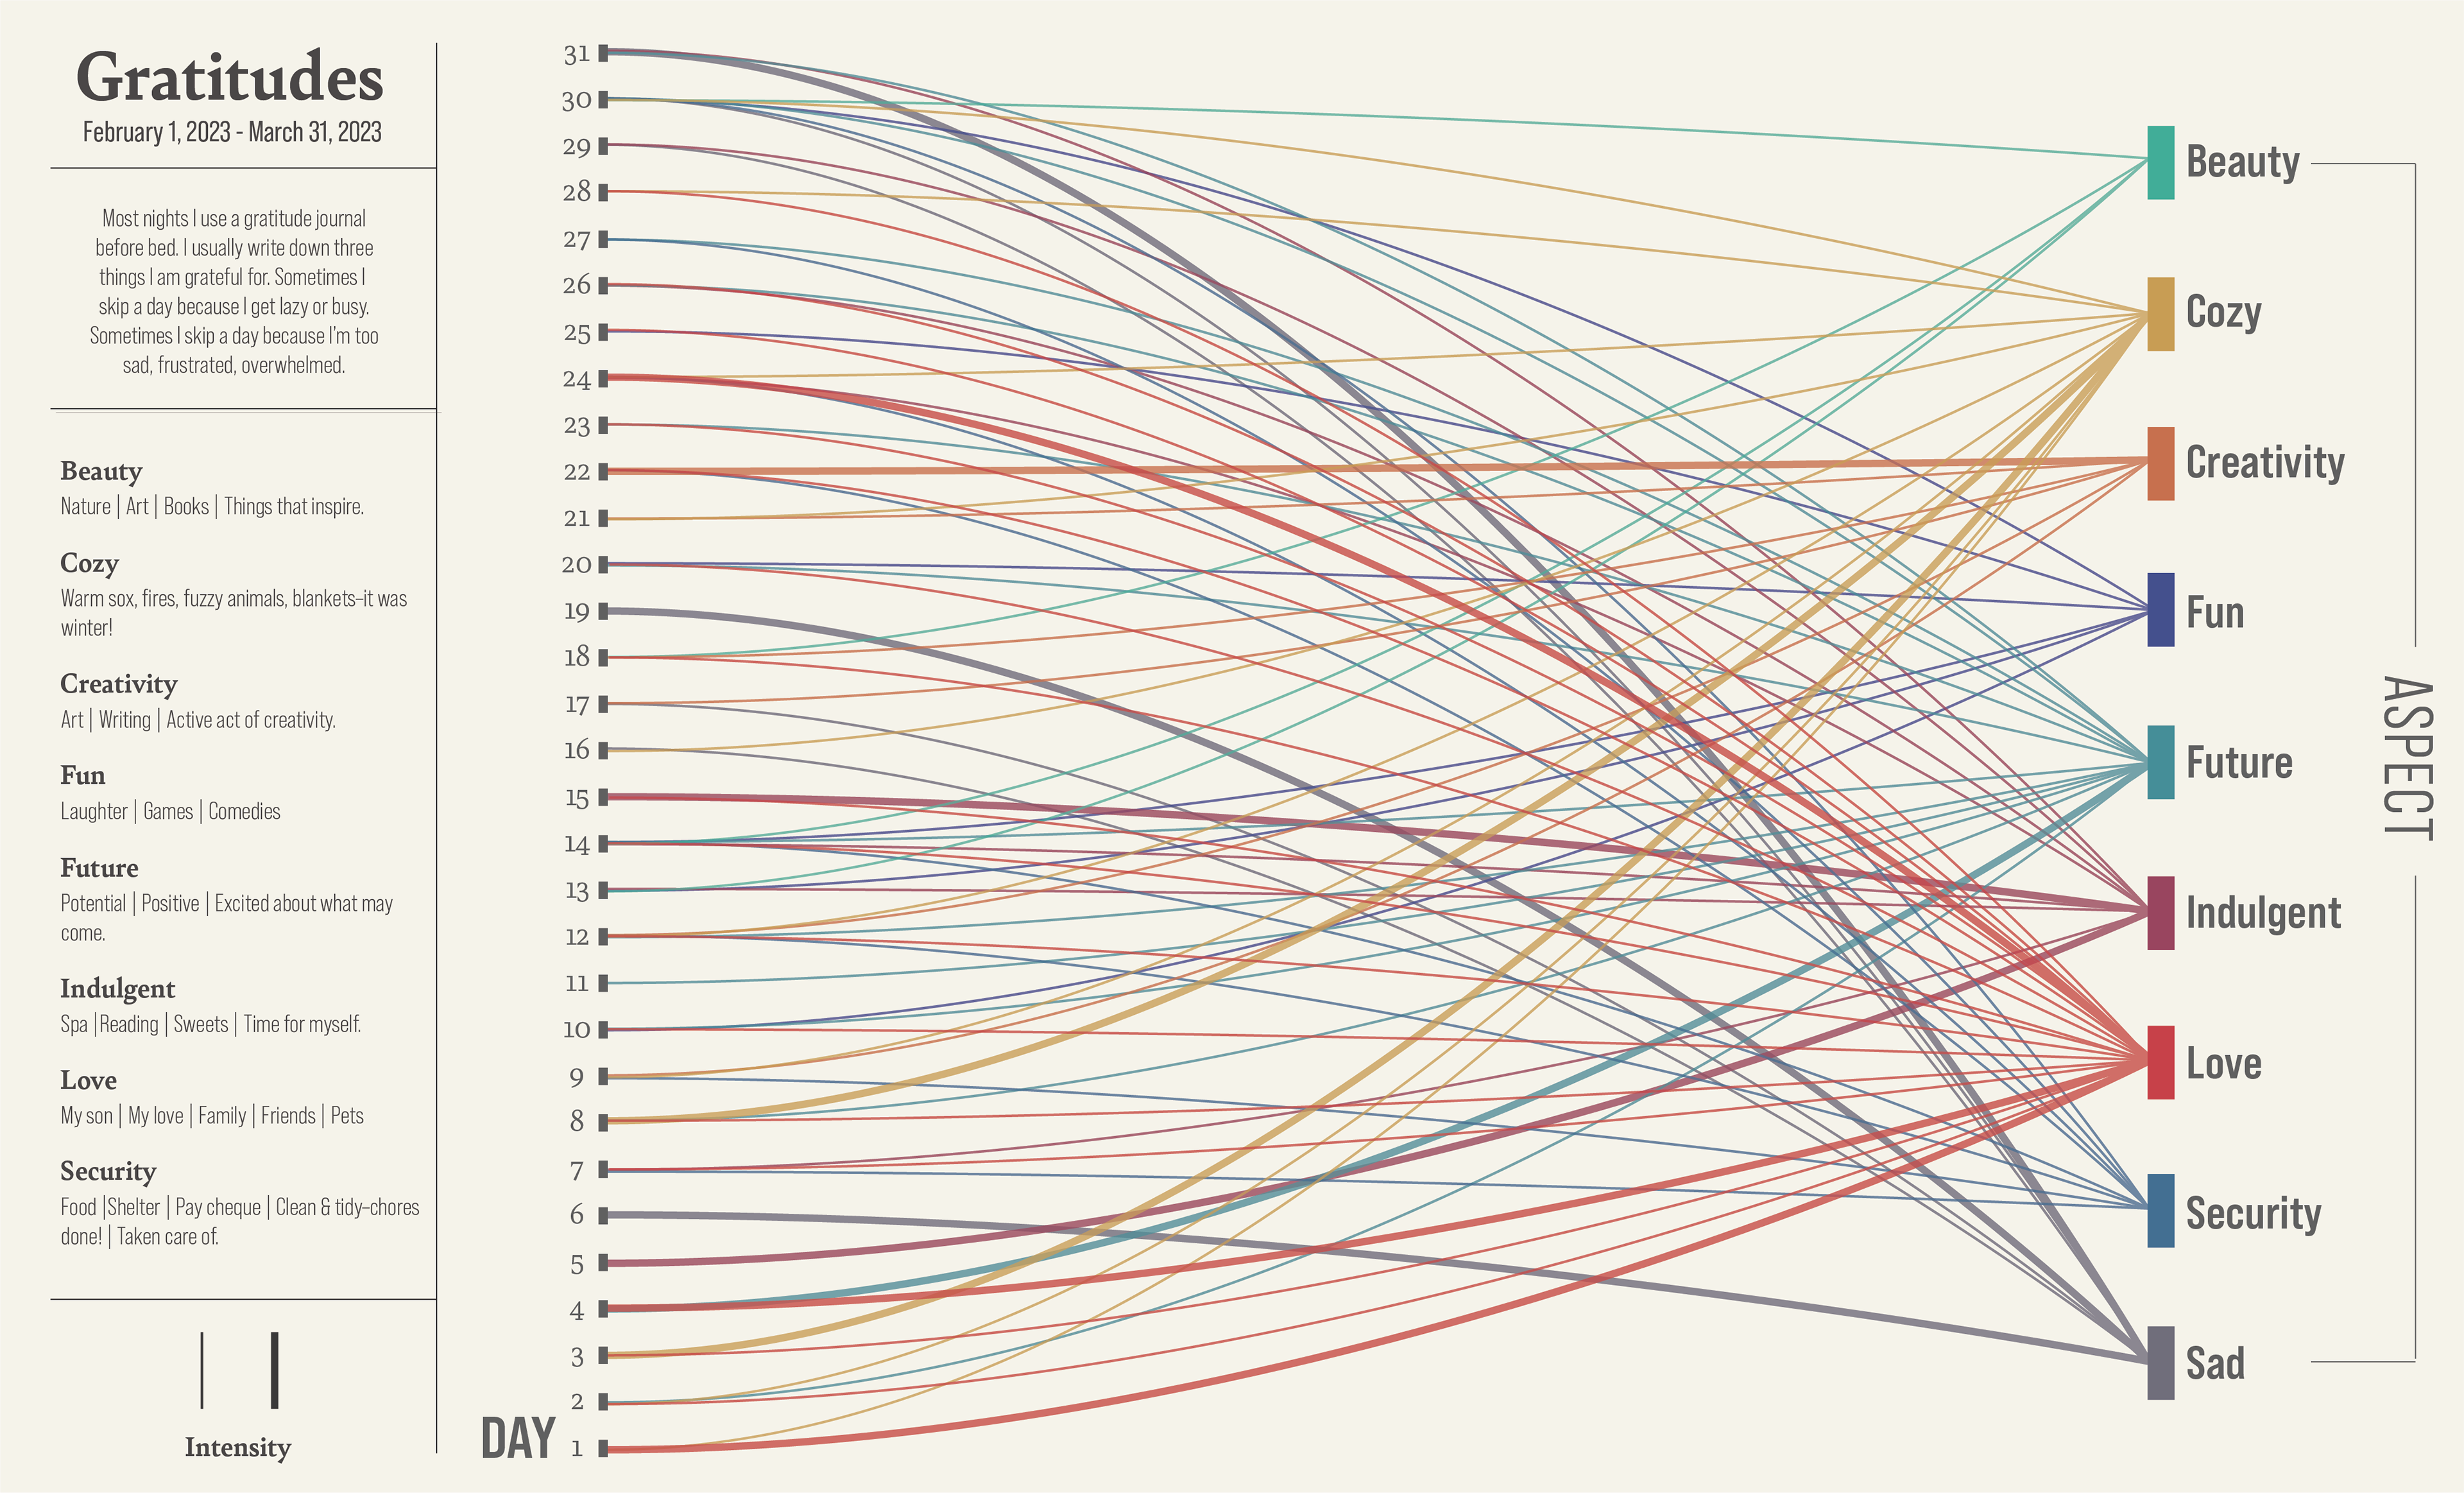
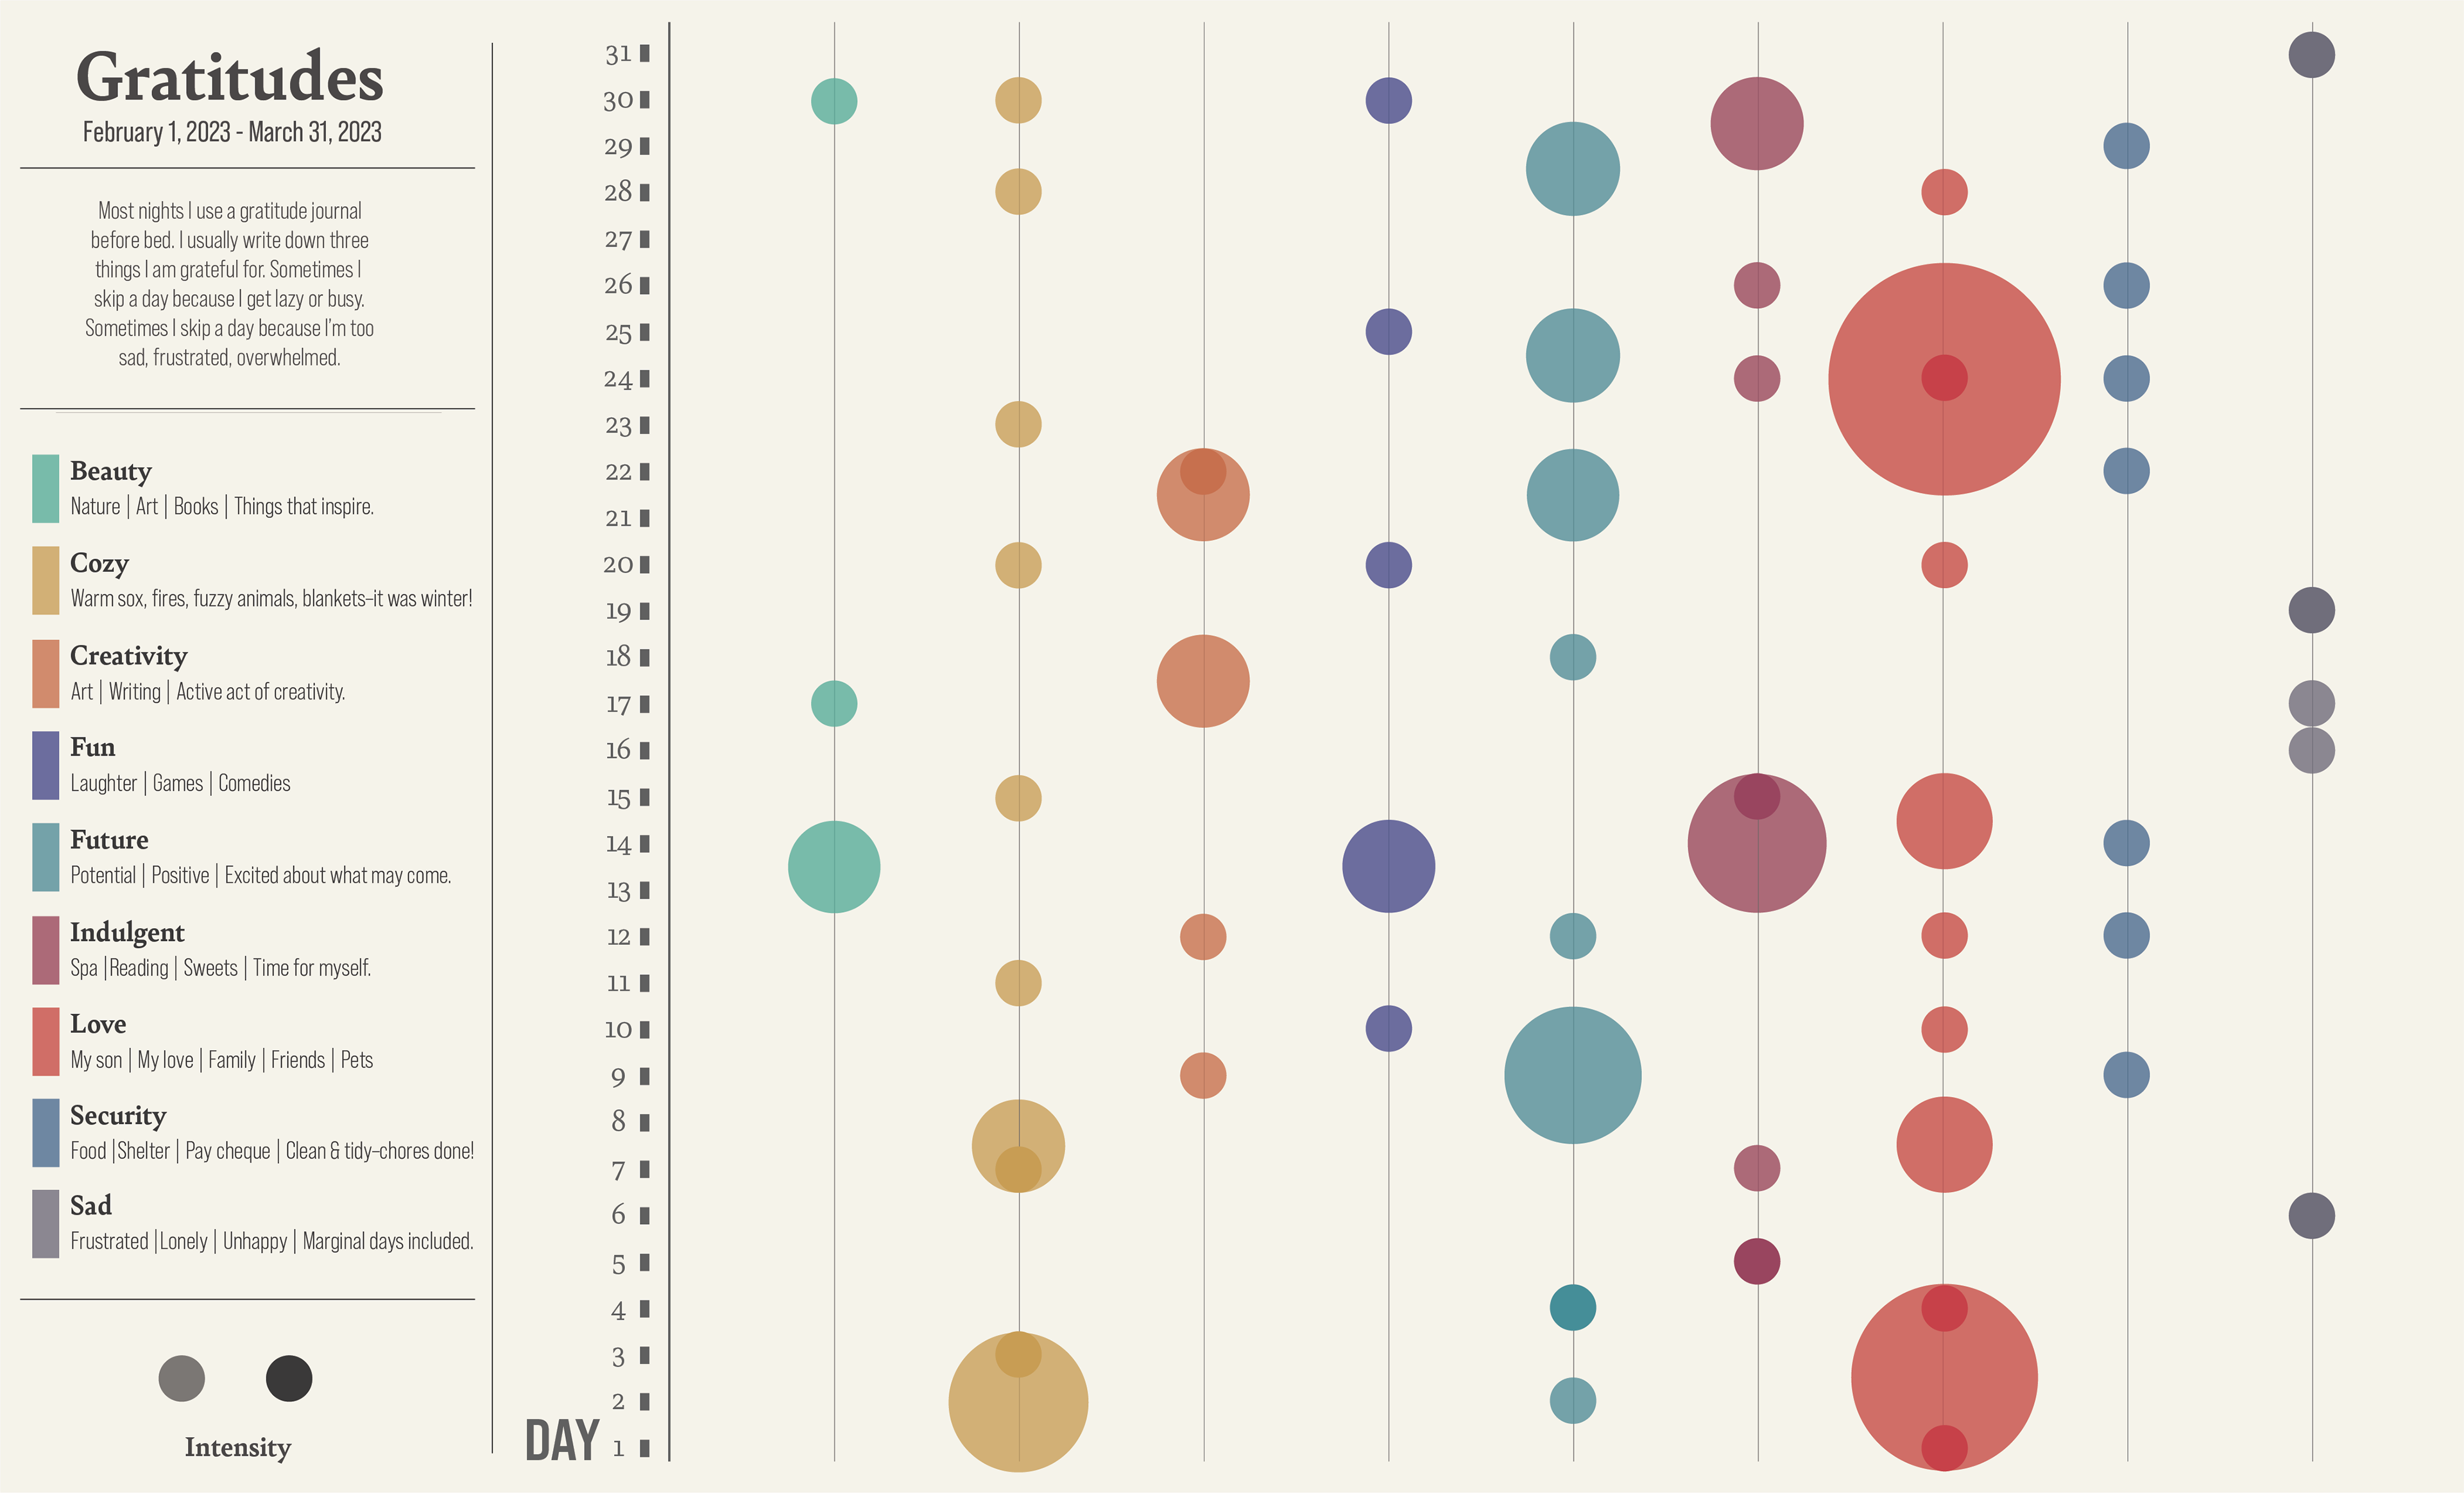
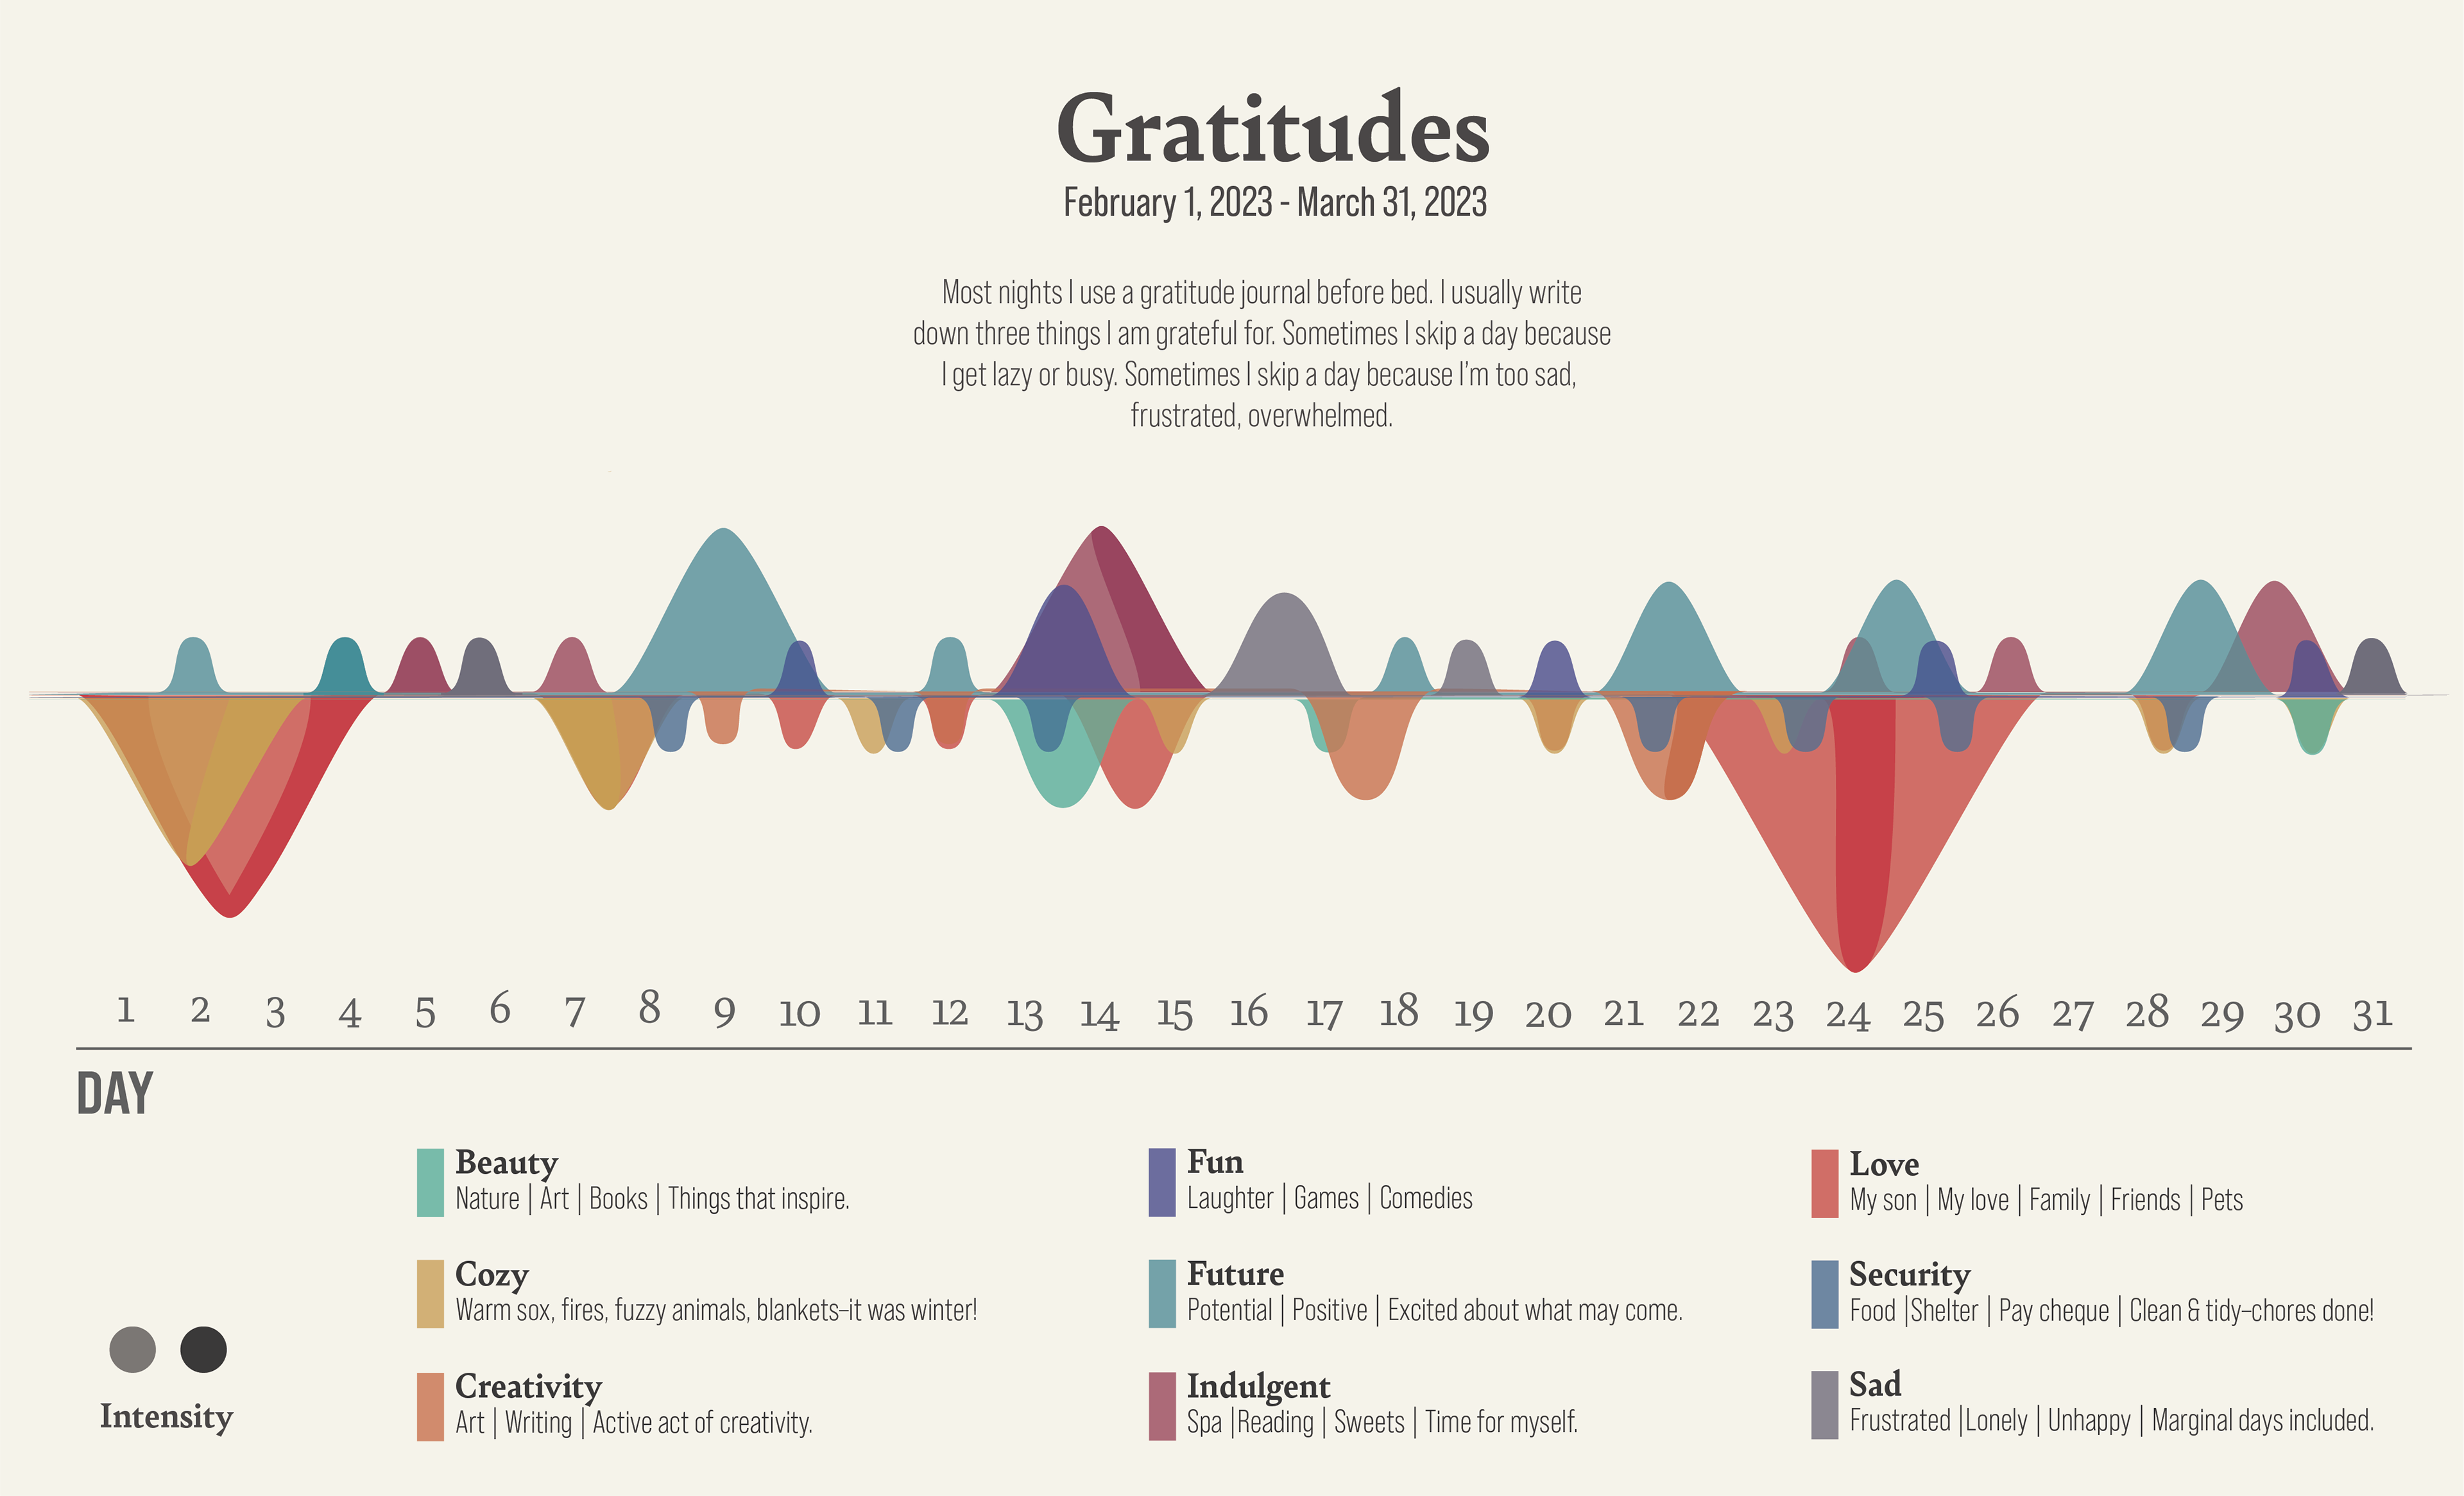
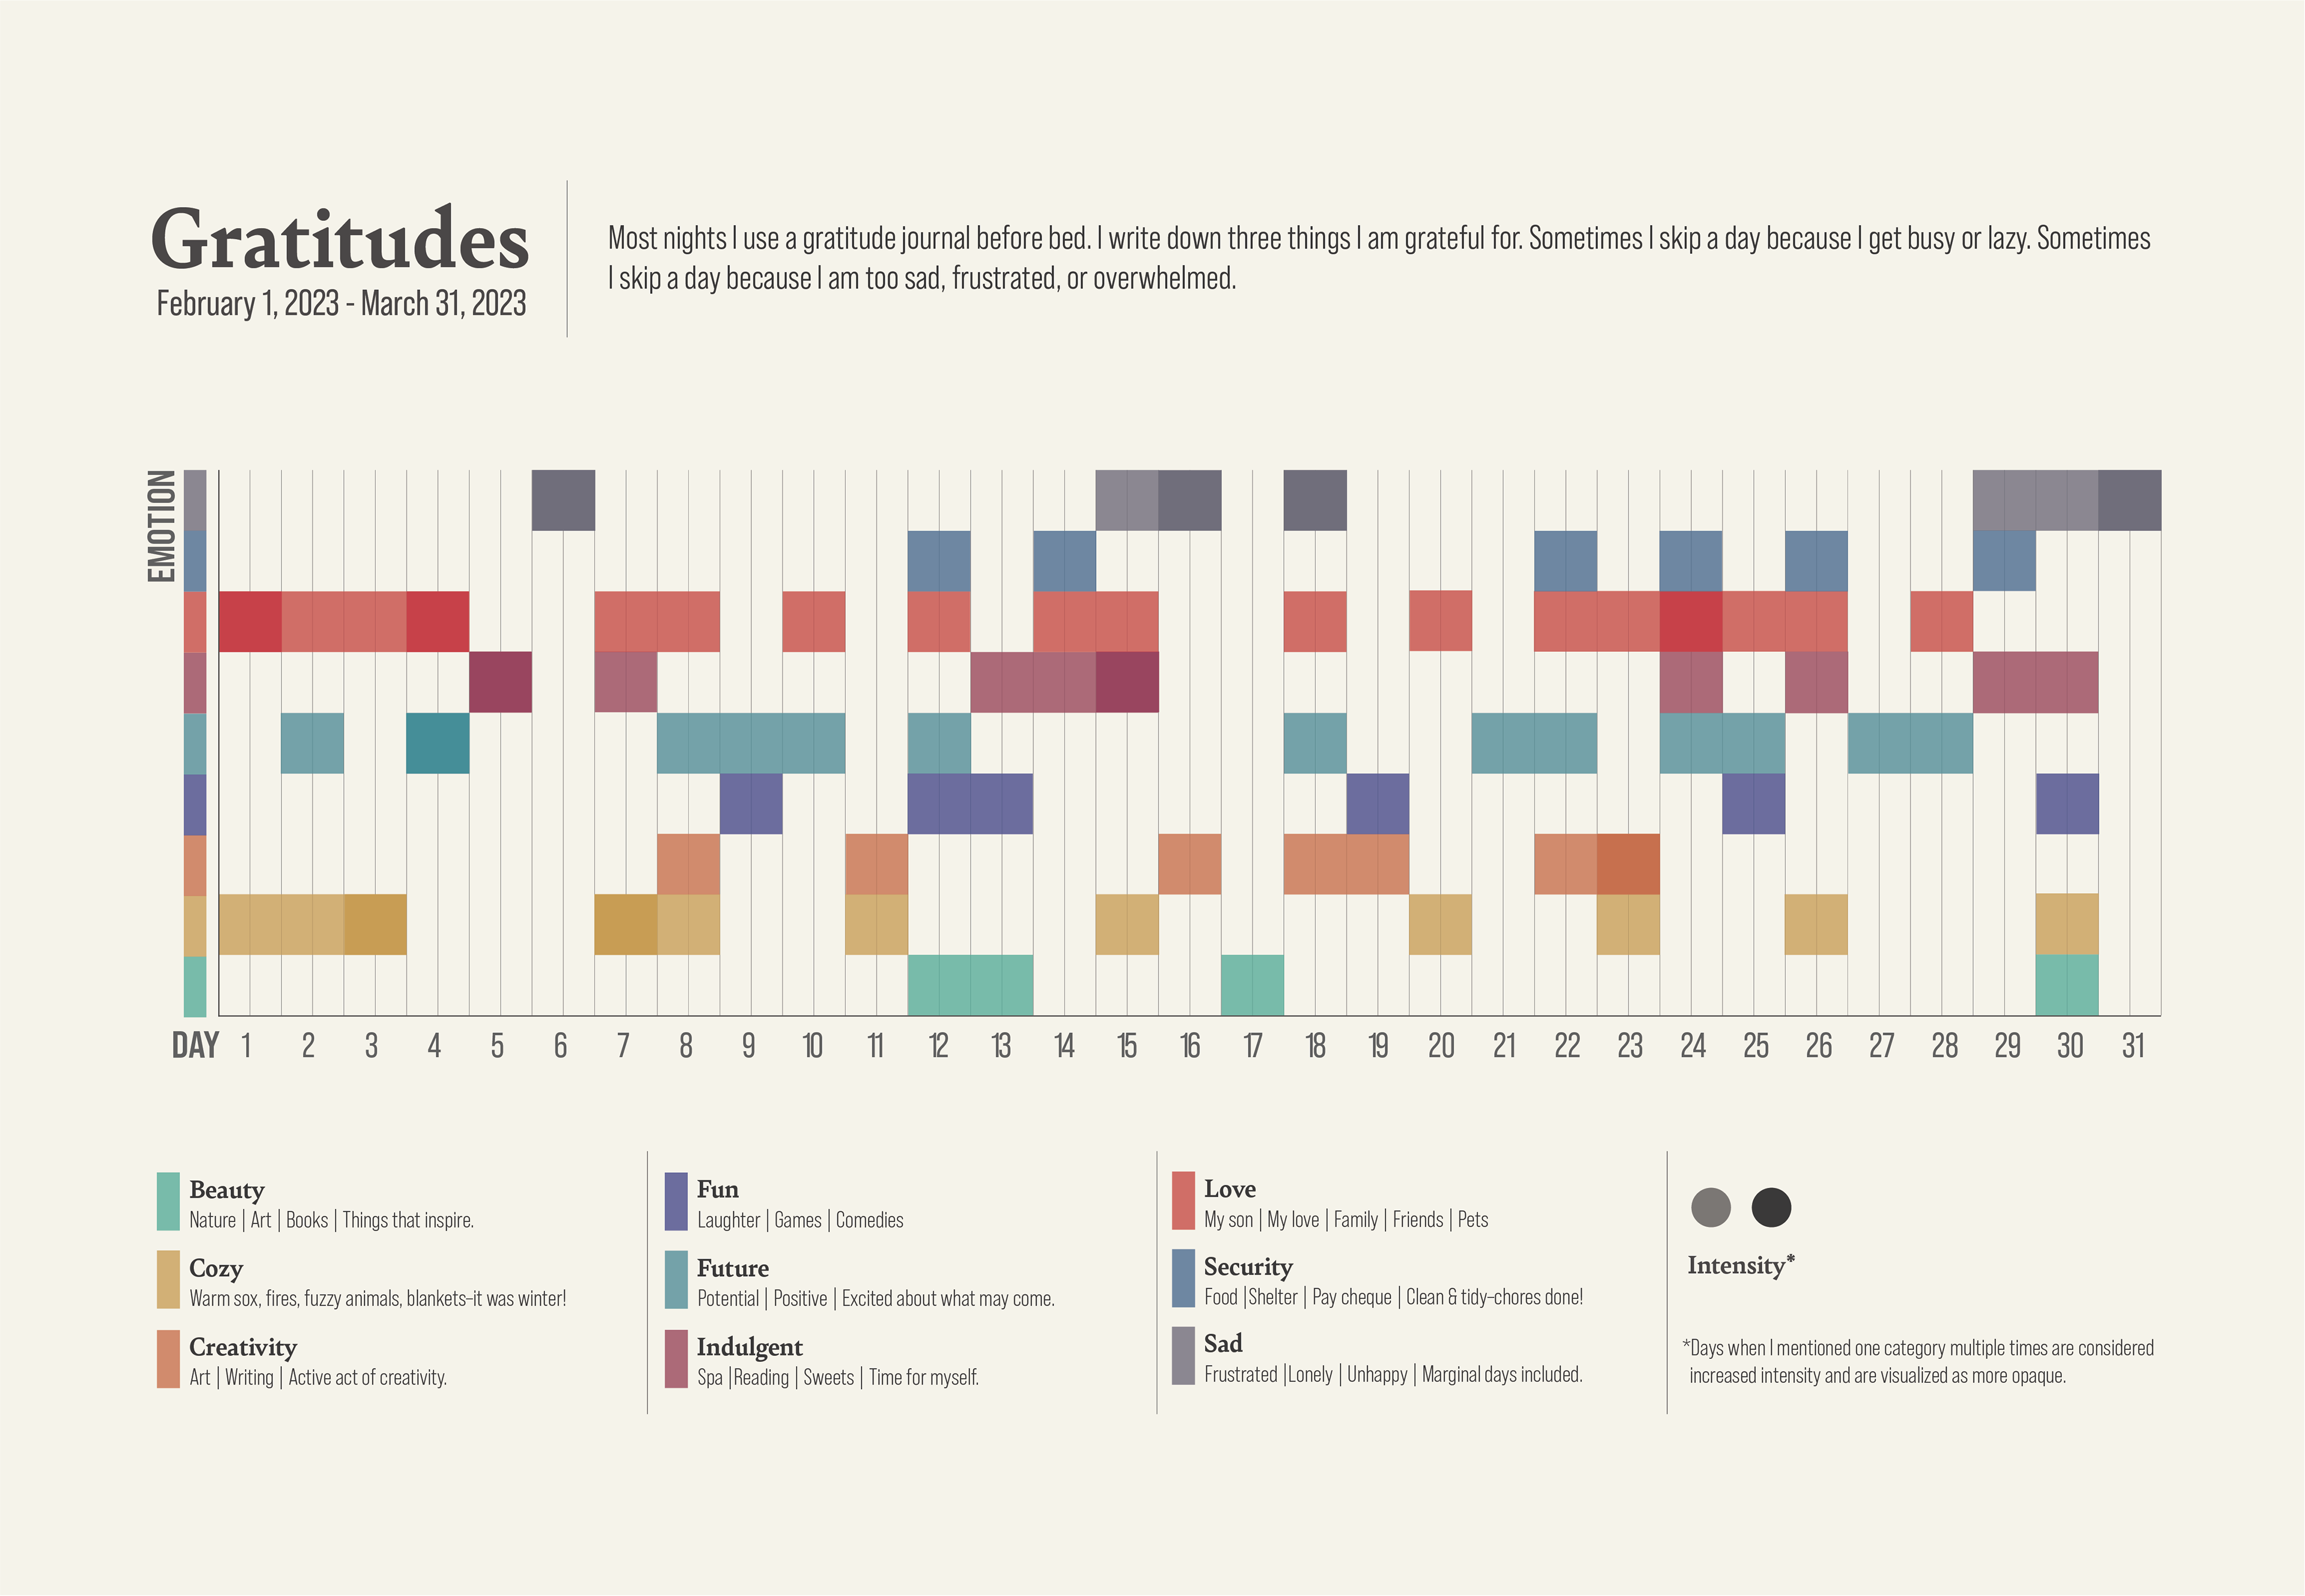
I keep a journal and I regularly write down what I am grateful for. I decided to use my own data for this series and was greatly inspired by Georgia Lupi's and Stephanie Posevec's book
I have since created data visualizations for nonprofits, galleries and museums, and ad agencies.